

Smart Speedometer FREE

3.6star
307 reviews
50K+
Downloads

Everyone
info
About this app
Monitor your speed, braking/acceleration G-forces in real-time very easily. Control your driving style in fuel-efficient and braking-efficient manner with history graph of average daily acceleration/braking G-forces. Select weather conditions (summer, winter or wet) and watch your driving history for many days. App is 100% FREE and with NO ads!
It's not necessary to place your device in the specific position and also no additional calibration required.
Constant accurate GPS signal is not required because the average value of many measurements is used.
App usage:
1) Measure speed, braking/acceleration G-forces in real-time.
2) Watch the state (G-force) of your brakes relative to the last days. Average braking distance depends on average G-force. So, for example, if average G-force is halved then the average braking distance is doubled.
3) Watch the usage dynamics of your engine (average G-force) for days
4) Watch stats for daily brakings and accelerations.(Note, app stores accels when speed is changed by more than 6 mph (10 kmh))
5) Compare average G-forces of your summer/winter tires.
FEATURES:
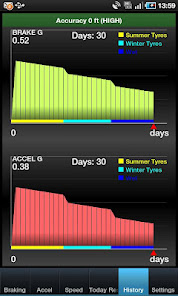
- Historical graph of average daily G-forces
Displays a graph of braking/acceleration average daily G-forces for days.
You can set preferred number of displayed days (from 10 days up to 1-year monitoring)
- Tires types and Weather conditions
Select summer / winter tires or wet weather.
The historical graph will be painted with appropriate colors.
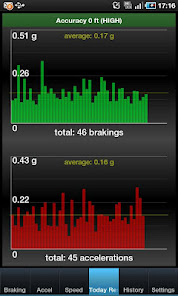
- Today graph
Displays statistics for the current day.
Displays graph of braking G-force per every braking.
Displays graph of acceleration G-force per avery acceleration.
(Note, app stores accelerations when speed is changed by more than 6 mph (10 kmh))
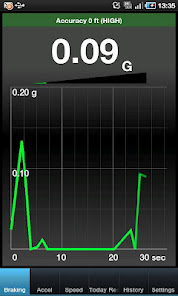
- Braking G-force real-time graph
Displays a graph chart covering the last seconds.
You can set 15/30 or 60 seconds.
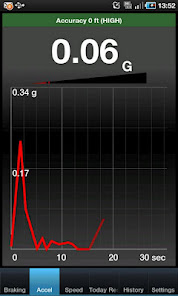
- Acceleration G-force real-time graph
Displays a graph chart covering the last seconds.
You can set 15/30 or 60 seconds.
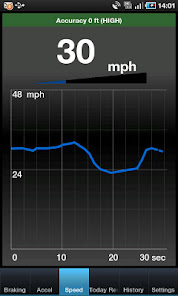
- Speed real-time graph
Displays a graph chart covering the last seconds.
You can set 15/30 or 60 seconds.
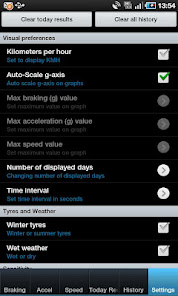
- Display units
Supports units such as miles and kilometers.
- Automatic scaling of the g-axis on graphs
- G-force warning
You can set braking/acceleration G-force limits, so when daily value is less a visual alert will notify you.
- Sensetivity level
Defines the minimum value of G-force to be recognized by application.
You can set LOW/MEDIUM or HIGH.
Note:
- Please note that the accuracy of speed readings depends on your GPS reception quality.
- You must set the correct Time Zone on your device to avoid possible problems with GPS signal
It's not necessary to place your device in the specific position and also no additional calibration required.
Constant accurate GPS signal is not required because the average value of many measurements is used.
App usage:
1) Measure speed, braking/acceleration G-forces in real-time.
2) Watch the state (G-force) of your brakes relative to the last days. Average braking distance depends on average G-force. So, for example, if average G-force is halved then the average braking distance is doubled.
3) Watch the usage dynamics of your engine (average G-force) for days
4) Watch stats for daily brakings and accelerations.(Note, app stores accels when speed is changed by more than 6 mph (10 kmh))
5) Compare average G-forces of your summer/winter tires.
FEATURES:
- Historical graph of average daily G-forces
Displays a graph of braking/acceleration average daily G-forces for days.
You can set preferred number of displayed days (from 10 days up to 1-year monitoring)
- Tires types and Weather conditions
Select summer / winter tires or wet weather.
The historical graph will be painted with appropriate colors.
- Today graph
Displays statistics for the current day.
Displays graph of braking G-force per every braking.
Displays graph of acceleration G-force per avery acceleration.
(Note, app stores accelerations when speed is changed by more than 6 mph (10 kmh))
- Braking G-force real-time graph
Displays a graph chart covering the last seconds.
You can set 15/30 or 60 seconds.
- Acceleration G-force real-time graph
Displays a graph chart covering the last seconds.
You can set 15/30 or 60 seconds.
- Speed real-time graph
Displays a graph chart covering the last seconds.
You can set 15/30 or 60 seconds.
- Display units
Supports units such as miles and kilometers.
- Automatic scaling of the g-axis on graphs
- G-force warning
You can set braking/acceleration G-force limits, so when daily value is less a visual alert will notify you.
- Sensetivity level
Defines the minimum value of G-force to be recognized by application.
You can set LOW/MEDIUM or HIGH.
Note:
- Please note that the accuracy of speed readings depends on your GPS reception quality.
- You must set the correct Time Zone on your device to avoid possible problems with GPS signal
Updated on
Safety starts with understanding how developers collect and share your data. Data privacy and security practices may vary based on your use, region, and age. The developer provided this information and may update it over time.

No data shared with third parties
Learn more about how developers declare sharing

No data collected
Learn more about how developers declare collection
Ratings and reviews
3.5
289 reviews

A Google user
- Flag inappropriate
- Show review history
August 23, 2019
I have problem with bracking monitoring. Sometimes it gives spikes 0.15 - 0.3 g when I go straight with constant speed. Dmitry, could you please look into this issue? Thank you
1 person found this review helpful
A Google user
- Flag inappropriate
November 8, 2019
Be better if you could use landscape aswell as portraits mode
1 person found this review helpful
A Google user
- Flag inappropriate
September 15, 2019
It only keeps speed history of the last 15 seconds
2 people found this review helpful
What's new
Bug fixes


